Making Hay Monday - September 30th, 2024
High-level macro-market insights, actionable economic forecasts, and plenty of friendly candor to give you a fighting chance in the day's financial fray.
Charts of the Week
It continues to be our view that one of the best ways to play a global interest-rate cutting cycle is via emerging market (EM) debt. We plan to write more on this topic soon, but we do believe nearly all U.S. investors are drastically underexposed to this asset class… if they have any exposure at all. The knee-jerk reaction is that bonds from developing countries are too risky; based on the experience of the last 40 years or so, that’s a reasonable conclusion. However, for many, if not most, emerging nations, it is also no longer accurate. Countries like Brazil, despite its many flaws, have much lower trade and fiscal deficits than the U.S. It is also offering real interest rates (i.e., after taking inflation into account) far higher than in America. Further, the above visual might be overly charitable to the USA, assuming inflation averages closer to 3% than 2% over the next decade. If so, that would mean the real interest rate on the 10-year U.S. T-note is a mere 0.75% presently.
A monumental factor that receives scant Wall Street or Mainstream Media coverage is how much of Corporate America’s remarkable profitability is a function of $2 trillion in deficit spending. Those deficits automatically lead to an accumulation of debt, a constant process these days of literally borrowing from the future to make the present appear better than it actually is. It’s difficult to precisely quantify how much of the 33% increase in S&P 500 earnings since 2019 have been a function of massive deficits.
However, it is certain that one can use a highly technical term to describe the impact: a lot. The same is true with the superficially impressive increases in America’s GDP. Ironically — or not — that rise has been very similar, a jump of roughly 30%. Again, it’s reasonable to wonder how robust the U.S economy would be if deficits were running at a more normal 2% or 3% of GDP. In dollar terms, that would mean about $1.4 trillion less in fiscal stimulus. Unquestionably, the hit to the economy from such a theoretical spending normalization would be “yuge”. But it’s also about as likely as the Seattle Mariners winning the World Series next year. (For those who are unaware, their streak of being a World Series no-show is the longest in Major League Baseball history.) While U.S. politicians show zero inclination to enact fiscal reforms — actually, they’re headed in the opposite direction — the bond market is highly likely to give them the mother of all reality checks.
“The BIG threat to the Indian bull market is that EVERY EM and EVERY Asian equity manager has been long India/short China. As China rips higher, the temptation will be to sell India (and Japan) to buy China…” -Louis-Vincent Gave
Champions Charts of Interest
Periodically, in our Making Hay Monday editions we run a collection of charts with interesting patterns for stocks, sectors and styles. (The latter is the official term for a major equity category like Large-Cap Growth or Small-Cap Value.) Today is the latest installment in that series and we are running this in lieu of our normal Champions section. As we usually do with these, some commentary on them is provided.
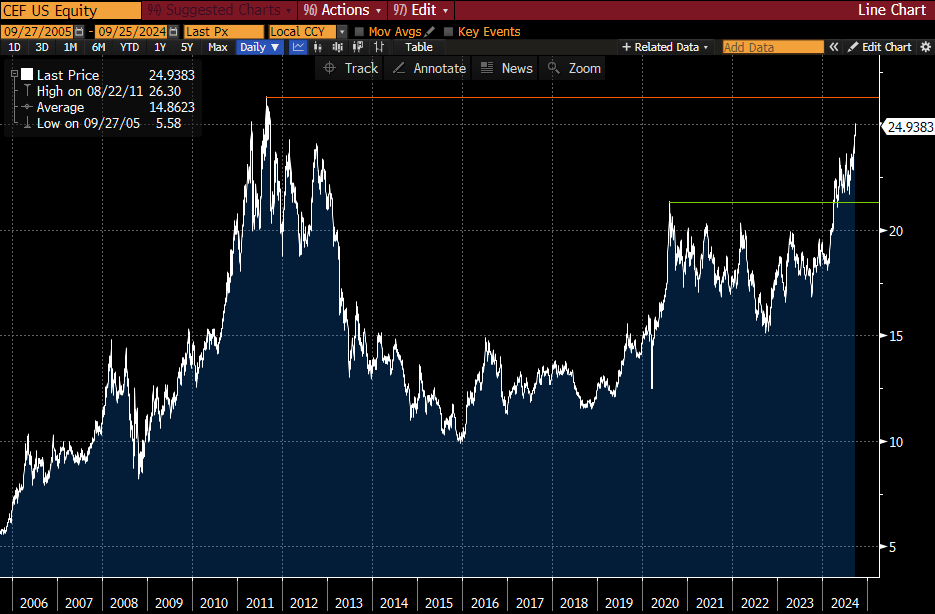
Price Chart of the Sprott Physical Gold and Silver Trust since 2006
In our experience, few investors are aware of the safe and convenient way to own gold and silver that the Sprott Physical Gold and Silver Trust (CEF) offers. Firstly, it’s freely traded on the New York Stock Exchange. Secondly, it trades at a slight discount, 4.7%, to the underlying value of its gold and silver holdings, otherwise known as Net Asset Value (NAV). Lastly, the metals themselves are held at the Canadian National Mint. In other words, they are in ultra-safe hands. The allocation between gold and silver is roughly 60/40.


