Making Hay Monday - September 16th, 2024
High-level macro-market insights, actionable economic forecasts, and plenty of friendly candor to give you a fighting chance in the day's financial fray.
Charts of the Week
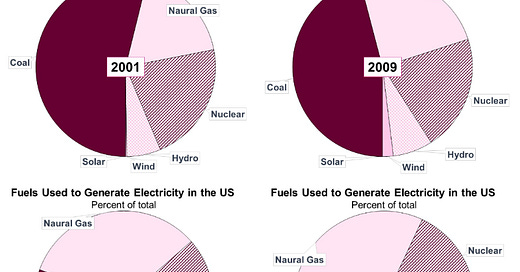
One of the primary forcings behind the 75% improvement in U.S. air quality over the last 50 years has been the displacement of coal by solar, wind and, particularly, natural gas. Looking back at the last (almost) quarter century, the shift in electricity generation sources tells the story most graphically. As you will read in this week’s main section of Making Hay Monday, the outlook for increased gas consumption, both in the U.S. and globally, has never been brighter. This is in vivid contrast to its present deeply depressed trading level. A key element in the bullish argument for natural gas is what is happening with electricity usage and prices. Per BofA’s Michael Hartnett, the “largest power gird saw capacity auction prices +800% for 2025”. It is no hype to say that is a truly stunning number.
BofA’s widely followed chief market strategist, Michael Hartnett, published this text last month relative to the above visual:
AI + renewables: largest US power grid saw capacity auction prices +800% for 2025 as retiring coal, accurately re-priced solar, surging AI demand strain capacity; note closing the 10 GW* power gap by 2030 requires a $12k copper price, 10% nuclear plant “uprating”, sweeping regulatory shifts… or cancelling AI hopes and productivity dreams.
An increasingly fragile U.S. power grid and soaring electricity prices are becoming undeniable ramifications of the “electrification of everything” effort, a key component of the Great Green Energy Transition. The collision between rapidly rising power demand and the high hurdles to bring on new energy sources , such as pervasive NIMBYism**, is likely to become more jarring.
*GW stands for gigawatt, one billion watts. This is roughly equivalent to large-scale nuclear power plants, such as the two that were (finally) completed in Georgia recently. These can power a city of roughly 500,000 inhabitants.
**NIMBY is the popular acronym of: “Not In My Back Yard”
“Hedge funds and other money managers sold the equivalent of 128 million barrels in the six most important futures and options contracts over the seven days ending on September 10… For the first time on record, funds held a net short position of 34 million barrels down from a net long position of 524 million barrels on July 2.” -John Kemp, founder of JKempEnergy, referring to the oil futures market
“Natural gas is the best transportation fuel. It's better than gasoline or diesel. It's cleaner, it's cheaper, and it's domestic. Natural gas is 97 percent domestic fuel, North America.” -T. Boone Pickens
Champions | Today’s Topic: Gas Pains
It has been a painful, if not excruciating, two years for natural-gas investors. Prices have come down by 75% on the current, or spot, futures contract (the month that is closest to delivery) since the summer of 2022, as you can see below. Even on the further-out months, it’s been about a 65% swan dive. Those numbers make the bear market in oil prices look like a mere cub.
Five-year price chart for the nearest-to-delivery U.S. natural gas contract (Henry Hub)
15-year price chart of the same contract
One main culprit has been two consecutive warm winters, particularly in Europe. This has been a Godsend to the Continent in the wake of Russia’s cut-off of around 40% of the Europe’s gas supply.


