


Making Hay Monday - November 4th, 2024
High-level macro-market insights, actionable economic forecasts, and plenty of friendly candor to give you a fighting chance in the day's financial fray.
Charts of the Week

This letter previously showcased certain defense stocks last year when they broke out of multi-year trading ranges. Per the above chart, this group has had a solid increase since that upside range expansion. At this point, it looks extended and may recede, particularly if there is post-election market indigestion. It’s a sector to keep an eye on, in our view, due to, unfortunately, the likelihood that global military spending is on a steep upward trajectory. However, should peace break out between Russia and Ukraine, a deeper correction is entirely possible. Valuations are also stretched at this point with two of the industry leaders trading at P/Es in excess of 20.
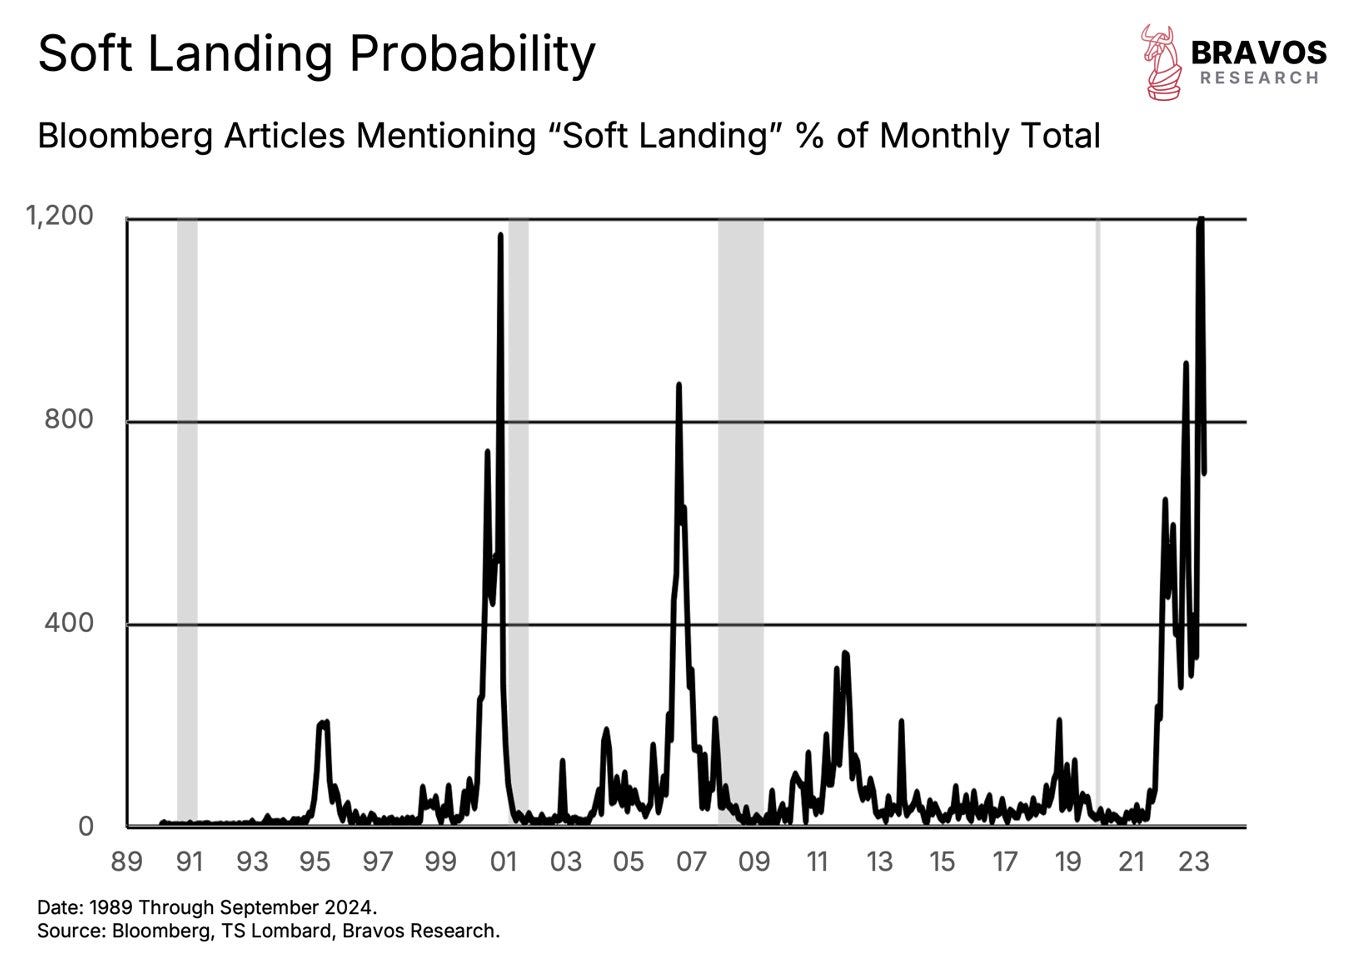
To say the soft-landing thesis has become widely held is a serious understatement. Ironically, it is up to a level last seen in late 2000 / early 2001, based on a compilation of Bloomberg articles on this topic. That was right before the recession that caused the Fed to cut interest rates down to a Great Depression-like level of 1%. This, in turn, triggered the housing bubble that would eventually threaten to bring down the global financial system. Expectations of a soft landing were also very high, as you can see, in 2007, right on the eve of the worst economic collapse since the 1930s. In other words, you might want to take the current nearly universal conviction with a couple 25-pound bags of salt. At this point, it is admittedly difficult to envision what could turn off the liquidity spigot that has provided so much ballast to both asset prices and the economy. However, the longer-term Treasury bond market has been breaking down lately and if that were to continue it could seriously wrong-foot the uber-bullish consensus.

“To buy when others are despondently selling and sell when others are greedily buying requires the greatest fortitude and pays the greatest reward.” -Sir John Templeton
“Trust is social bonding and societies without it are stalked by social unrest, upheaval or even war. Distrust is a brake on prosperity, because distrust is a break on exchange.” -Dylan Grice, co-founder of Calderwood Capital, and an exceptional macroeconomic strategist, with words that strongly resonate these days
K1 OK
It’s been my experience that, unfortunately, far too many investors avoid those midstream energy securities commonly known as Master Limited Partnerships (MLPs) because of the K1s they generate. One hostile comment from their CPAs is often enough to cause them to shut the door, now and forever, on these intriguing investment vehicles. The intent of this edition of Making Hay Monday (MHM) is to open some minds — and, maybe, some wallets — in this regard.
First, though many MHM readers are aware of what we’re now going to convey, we’ll do a short tutorial on midstream in general and MLPs in specific. It’s my belief there are far more MHM subscribers who don’t know what’s coming next than those who are up to speed.
The reason they are called midstream is because they almost always operate pipelines and other intermediate energy infrastructure assets such as processing plants and transportation facilities. These sit in between upstream production (oil and gas wells) and downstream distribution (gas stations and utilities). Hence, they are in the middle of the energy supply chain, ergo the name midstream.
Refineries also qualify, though that is a volatile space within the energy ecosystem. Even the best refinery operators have had extremely wild swings in their yearly profits, sometimes actually tipping into losses. They are typically hurt when oil prices soar and their margins are crimped. That’s why they tend to be better wrapped inside of a gigantic oil company like Exxon or Shell. In that case, the upstream side of the enterprise usually enjoys windfall profits when oil prices go vertical, more than offsetting the struggles with their refining operations. (For sure, sometimes they boom and bust together.)
The pipeline, storage and transmission business, on the other hand, is almost utility-like in its cash flow and earnings reliability. This is not to say that they can’t encounter severe challenges during an extraordinary event like the Covid lockdown of the global economy. That crushed demand to an extent never before seen for obvious reasons. Consequently, the MLP index suffered one of its worst declines in its history.
The Main MLP Index (AMZ) Price Chart from 2015 through 11/1/2024

You may notice the breakdown in this index during the early days of Covid. Evergreen Gavekal, where the Haymaker serves as Co-CIO, did recognize the significance of that event and acted accordingly. The absolute pasting these generally dependable businesses experienced in the spring of that pandemic-wracked year created a generational buying opportunity… for those willing to capitalize on the utter panic. As is often the case during waterfall-like declines, most were too terrified to commit capital.
In fairness, even though the sector stayed profitable during 2020, most of its constituents reduced their payout rates. That accelerated the mass exodus out of this group. The combination of the distribution cuts and the cliff-dive in share prices — with some crashing to the $3 range from $30 or higher — was enough to cause most investors to agree with Jim Cramer that this sector was uninvestable. Unfortunately, that turned out to be a massive mistake.
As you can see in the preceding chart, the MLP index bottomed in the spring of 2020. From there it proceeded to essentially quadruple. With distributions included, the total return on the MLP index from the late March 2020 bottom was 347%, dramatically exceeding the S&P 500’s own moonshot-like rise.
Chart of the Main MLP Index from March 2020 through 11/1/2024 (the table to the upper left displays its total return, i.e., including income from distributions)
