Charts of the Week
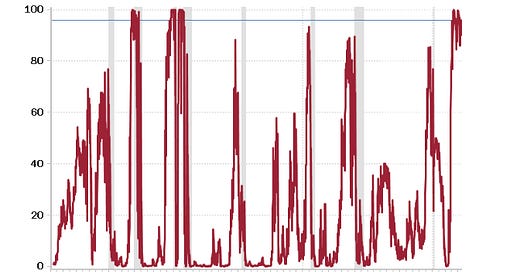
The first chart is another way of looking at the inverted yield curve. In this case, it is reflecting the inversion between shorter term U.S. Treasurys. While many pundits today blow off the upside down nature of the yield curve – partially, because, thus far, it’s been a false alarm–its track record is impeccable, as you can see. (The gray shaded areas indicate recessions.) In fact, shorter lasting and less inverted instances than we have today have often presaged recessions. Focusing on those times when this metric has been in the upper 70s or higher, the hit rate has been seven for seven, going all the way back to 1960. Similarly, the Data Revision Index is also flashing crimson red. Downward revisions have become increasingly prevalent, particularly with the official jobs report (including two last week to the Non-Farm Payroll Surveys for April and May). Despite that there has not–yet–been an officially declared recession, ignore these time-tested markers at your own risk.
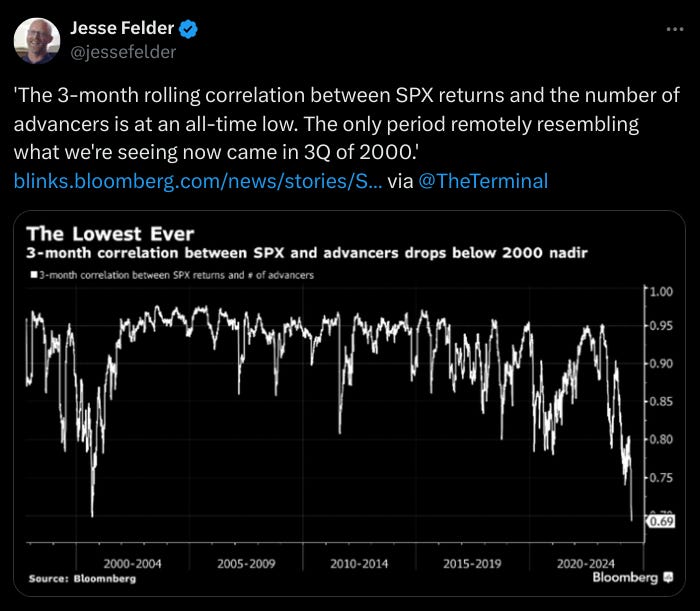
The above visual from Jesse Felder and Bloomberg should grab your attention. It is one of the most powerful illustrations of the extraordinarily narrow present market leadership. The prior period he mentions, in 2000, was followed by one of the worst bear markets in history, particularly for tech stocks which had been just as torrid back then as they are today.
“On average, the recession nobody ever seems to see begins once the jobless rate rises +0.5 of a percentage point from the cycle low. It now is up +0.7 ppts.”
“…the fabled Sahm Rule, which posits that recessions occur when the three-month average of the unemployment rate rises at least 50 basis points above the prior 12-month low, was practically triggered on Friday.”
“Since the beginning of 2023, the nonfarm payroll data have been revised down 82% of the time.”
All quotes from David Rosenberg in today’s Breakfast with Dave
Palladium: A Shining Beacon in a Volatile Market
Champion
As we steer through a period of economic unpredictability, palladium is emerging as a standout investment opportunity. Its unique demand dynamics, supply constraints, and strategic importance make it an asset worth considering. Let's dive into why palladium is shining bright and how Sibanye Stillwater Ltd. (SBSW) might – heavy emphasis on “might” – be positioned to capitalize on this precious metal.
Market Performance and Valuation
Palladium prices have been on quite a ride, peaking above $3,000/ounce in 2022. By May 13th of this year, when we approvingly wrote it up in that Making Hay Monday, it was trading at $980, essentially a two-thirds buzzcut. After a slight upward bump immediately after that piece ran, it swooned over 10%. In mid-June, it was actually below $900. From there it came roaring back to $1,035 (as of last Friday).
Perhaps accounting for this volatility, and the beating it has experienced since early March of 2022, Nornickel predicts a market surplus of 300,000 ounces in 2024, driven by recycling outpacing new demand. Previously, there was a deficit of 200,000 ounces in 2023 and leading up to the Covid lockdowns, eight consecutive years of supply shortfalls.
Unsurprisingly, the pandemic cratered auto sales, which in turn severely impacted Palladium (Pd) demand due to the fact that it is a key input for catalytic converters. Fascinatingly, even during the pandemic-driven collapse in global light vehicle production, it never traded much lower than $1,500.


