Making Hay Monday - January 29th, 2024
High-level macro-market insights, actionable economic forecasts, and plenty of friendly candor to give you a fighting chance in the day's financial fray.
“Adjusting for SPR* releases, inventories have fallen by 800 (million barrels per day) over the last three years—or by 750,000 (barrels per day), representing the sharpest decline in oil market history.” -Leigh Goehring and Adam Rozencwajg, founders of energy research firm G&R, in their November 29th, 2023 Natural Resource Market Commentary.
*The Strategic Petroleum Reserve (now a much smaller reserve than it once was)
In this edition of Making Hay Monday, I’m going to use a slightly different format. As I did once before, I will display a number of noteworthy charts focusing on my usual multi-year breakouts — stocks making three-year highs.
Then, in the section for our precious paid subscribers, I’m going to get a bit more specific. This will include one of my favorite charts. Further, I’m going to touch on some names I should have showcased previously but didn’t (my bad). We’ll get to those early on to expose my obtuseness to all readers. There will be a lot of visuals and relatively little text (no applause, please), at least until the post-paywall section, so let’s get to it!
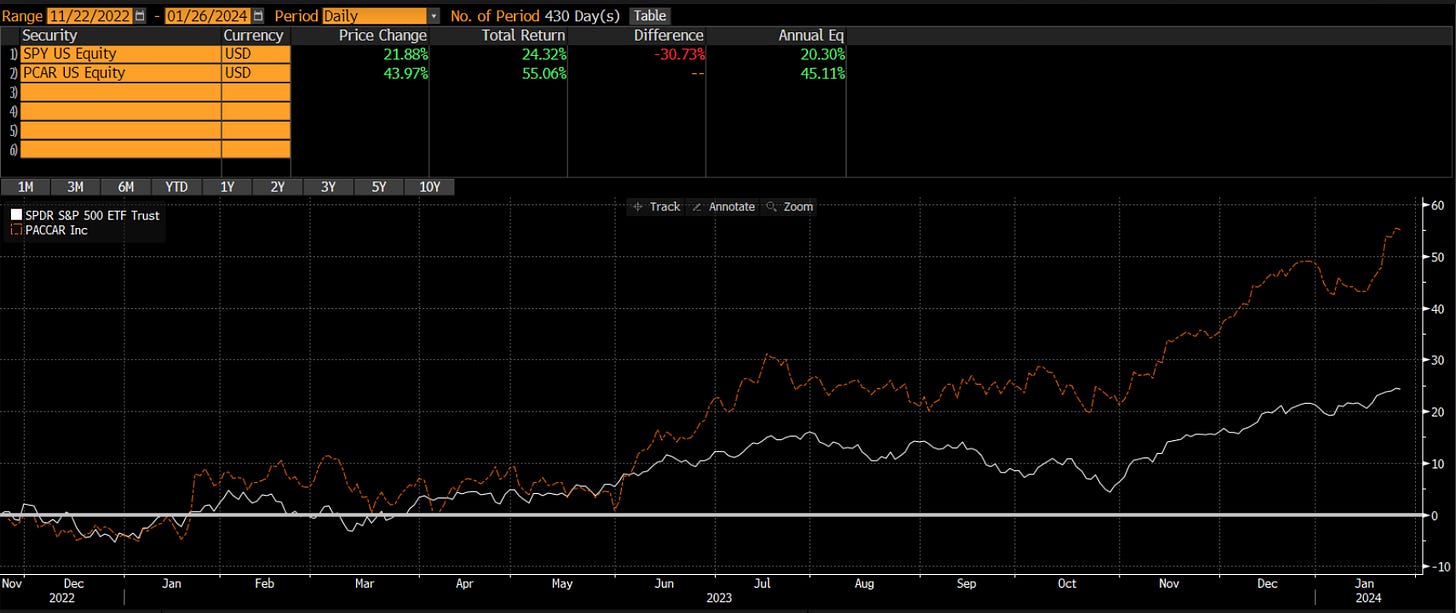
First, under the category of those that got away, let’s look at a Seattle-area favorite, Paccar (PCAR), America’s leading Class 8 (aka, grande size) truck manufacturer. Because an Evergreen client has a large position in this one, we keep a close eye on its trading behavior. As you can see below, it had an inarguable breakout to a multi-year high in November 2022. Better yet, it was an all-time high (ATH). As I have written recently, those are particularly attractive in my way of looking at the world.
PCAR - Five-Year
(Click chart to expand)
(Click chart to expand)
When this impressive “range expansion” (that’s a term used by the billionaire investor Paul Tudor Jones to describe these developments) occurred, I was perplexed, as I often am. The trucking industry was a mess back then. There was a shortage of drivers, pushing wage rates up dramatically. Diesel fuel was prohibitively expensive. U.S. GDP had contracted for the first two quarters of 2022 and the yield curve had inverted, a classic bearish economic indicator. China was still locked down, a major drag on global economic growth. A raft of trucking company bankruptcies seemed inevitable and, in fact, they did happen (adios, Yellow Freight).
But as you can see in the first chart, PCAR’s breakout was a superb buy signal. It is up about 55% since then versus the S&P rising a commendable but much less lucrative 24%.
Next, is a name we have internally debated numerous times at Evergreen Gavekal: IBM.
Big Blue has definitely given its shareholder base, which once included Warren Buffett’s Berkshire Hathaway, a bad case of the blues. Despite the recent rally, to be immediately discussed, its stock price is below where it was in March of 2013. This is notwithstanding a monster bull market in nearly all things tech over the past decade.
Unsurprisingly, IBM’s many failed restructurings have soured most investors on its prospects, especially the growth cohort that dominates tech trading. Big Blue’s early forays into quantum computing and AI failed to overcome its numerous slow-growing or, even, contracting business lines.
Yet, as I noted to my team this past November, the chart was a thing of beauty at that point. This is because my favorite pattern is one where there has been a multi-year trading range (at least three years… but the longer, the better) that is punched out to the upside. As you can readily see below, that’s exactly what it did. As is also apparent, it has kept right on running.
(Click chart to expand)
On a happier note for some Evergreen clients is the following visual on a company by the name of CRH, PLC. It is part of the oligopoly that owns and operates aggregate resources, basically the quarries and mines that provide the key ingredients to make cement. In this case, we quickly became fans of its fundamentals because of how profitable this small industry is, one that is essential for the U.S. of A’.s bold attempt at re-industrializing.
Because CRH was UK- listed (hence, the PLC), it sold at a gaping discount to its American competitors Vulcan Materials and Martin Marietta Materials, both of which boast tech-type P/E ratios, undoubtedly due to their enviable earnings records over the last 10 years. CRH’s valuation discount was despite having significant U.S. operations (even after its recent sprint, it is trading at a mere 14 times this year’s earnings estimate.) In the case of all three companies, this is one of the biggest barriers-to-entry industries I’ve ever encountered.
Better yet, it had announced it intended to de-list in London and re-list on the New York Stock Exchange. We felt this would serve as an upside catalyst. Fortunately, thus far, it’s worked out that way.
Per the below image, you can see the critical “range expansion” in June of last year. Unlike with IBM, but similar to PCAR, this was an all-time high (ATH). As you will also notice, it has kept on scooting higher. It, too, has performed better than the overall market, rising 30% since last June vs 12% for the S&P.
CRH - Five-Year
(Click chart to expand)
Now, for a few recent breakouts and then I’ll get to this week’s highlight…


