Making Hay Monday - January 22nd, 2024
High-level macro-market insights, actionable economic forecasts, and plenty of friendly candor to give you a fighting chance in the day's financial fray.
“Sometimes I call it ‘crypto crappo’, sometimes I call it ‘crypto shit’. It’s just ridiculous that anybody would buy this stuff. … It’s totally absolutely crazy, stupid gambling.” -Charlie Munger, from a February 2023 CNBC interview
Breakout or Breaking Point?
To great fanfare, the S&P closed at a new high last week. After a soft-ish start to the year, the rally that graced the end of last week left the famous 500 higher by 1.5% thus far in 2024. Then there’s everyone’s favorite index, the NASDAQ, which is up 2% (both through Friday). Neither sounds like a lot, but at those paces, full-year returns would be 26% and 35%, respectively.
Champions
It goes without saying that annualizing early-year returns is treacherous. Nevertheless, the S&P’s upside breakout is noteworthy. As nearly all Haymaker readers are aware — because they’ve had it beaten into them by yours truly — I view multi-year breakouts very positively. All-time highs are an even brighter green light.
Interestingly, the NASDAQ has not made a new all-time high. This is despite a monster 55 weeks (last year plus the first 3 weeks of 2024). However, once again that magnificent cohort is powering the gains. Only, thus far this year it’s now the Magnificent Six. Tesla has already slid 16%, which doesn’t break my heart given my repeated warnings about the challenges it faces. But in very 2023-like fashion, the other six have produced essentially 100% (99.6%, for you sticklers) of the S&P’s returns.
There are also some other factoids that might raise some eyebrows and more than a few concerns. For one thing, the breakout isn’t yet decisive. At least for now, it’s a minor all-time high (ATH). Also, declining stocks are leading advancing issues by a ratio of 1.6 to 1 this year. Further, 10 out of 11 S&P sectors are not making new ATHs.
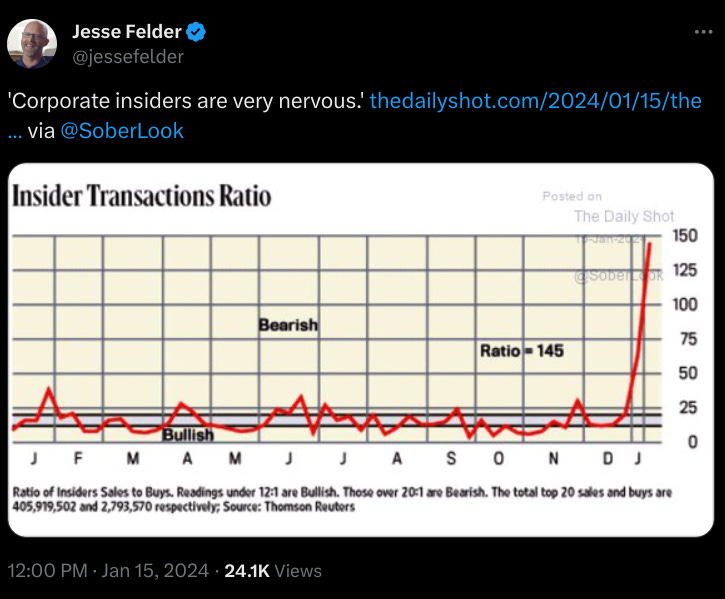
Also ominous, per my pal Jesse Felder, is that non-dealer positioning (essentially retail speculators and hedge funds) in the S&P 500 futures contract are also at ATHs. That’s not the kind of all-time high you want to see… if you are bullish on stocks. As you can see, the last time this group was as heavily long the S&P futures was in late 2021, right before 2022’s market wipeout. As you may recall, it was led by the NASDAQ’s nauseating 33% cliffdive. That’s why the “Naz” has yet to reclaim its own ATH. Even more startling is Jesse’s chart on insider selling. Clearly, those in the know want out in a big way.
To be fair to the bullish case, liquidity is abundant and financial conditions recently eased at one of the fastest clips on record. Also extremely supportive is the latest blowout in the federal deficit. In just the first three months of this fiscal year, that has amounted to nearly $500 billion. With the Fed failing to rein in animal spirits running amok in the financial markets, that is tantamount to a series of rate cuts. Thus, both fiscal and de facto monetary policy are supportive of the economy, as well as the stock market. (Of course, there is no way the Treasury and the Fed are being influenced by the upcoming presidential election, right?)
Despite the liquidity tsunami, the venerable Lacy Hunt is convinced recessionary forces are in the process of overwhelming the expansionary pressures. In a section of his most recent quarterly report, titled Behaving Like A Recession, he had this to say:
Over the past year, inflation, real GDI*, hours worked of all non-agricultural employees, national saving, delinquencies, foreclosures and bankruptcies portrayed a recessionary environment even though real GDP and payroll employment continued to rise. Key indicators, derived mainly from industry sources rather than the government statistical mill, exhibited characteristics of a hard landing. New vehicle sales, new home and existing home sales, respectively, were 15%, 43% and 42% below their peak levels of the past five years. Prescient cyclical indicators point to an expanding list of recessionary conditions. Not only did the long running inversion of the yield curve persist through the fourth quarter, but it also became even steeper. A prolonged drop in the index of leading economic indicators was extended. The high multiplier manufacturing sector moved further below its cyclical peak reached last October and the deep drop in world trade volume has never happened without a global recession since the series originated in 1992.
*Haymaker note: Gross Domestic Income, traditionally a more accurate measure of the economy than GDP, at least at turning points.
As I process data such as the above — and much, much more — an old quote from one of America’s greatest newsmen echoes in my mind. Many decades ago, Edward R. Murrow quipped, “If anyone isn’t confused, they don’t understand the situation.” There are always economic and financial cross-currents, but right now those are flowing with the force of a riptide.
The best plan of action, in my view, at this point, is to be selectively bullish and selectively bearish. That’s basically what I have been doing for the most part in these pages as I provide readers, at least of the paying variety, with ideas that seem promising and those that look like sinkholes for investor capital.


