

“It’s best to think of financial markets as examples of mass human behavior.” -Billionaire investor Paul Singer
“To see three months in a row of fewer than half of industries adding jobs is unprecedented outside of a recession,” said Wells Fargo senior economist Sarah House, per The Wall Street Journal, August 2nd.
“In my opinion, today’s Jobs Numbers were RIGGED in order to make the Republicans, and ME, look bad.” -President Donald Trump, who fired the head of the Bureau of Labor Statistics on Friday after the release of the disastrous employment report.

One of the most amazing aspects of the stock market is how it can cover up a plethora of problems when it is relentlessly rising. This is particularly the case when it stays elevated for years and any corrections are fleeting.
As you can see from the following chart, created by the legendary John Hussman and retransmitted by my good friend Jesse Felder, the U.S. stock market has been in uncharted (pardon the pun) territory since 2019. John uses gross value added including estimated foreign revenues for U.S. companies. It’s essentially a tweaked price-to-sales chart.
John Hussman’s preferred market valuation indicator
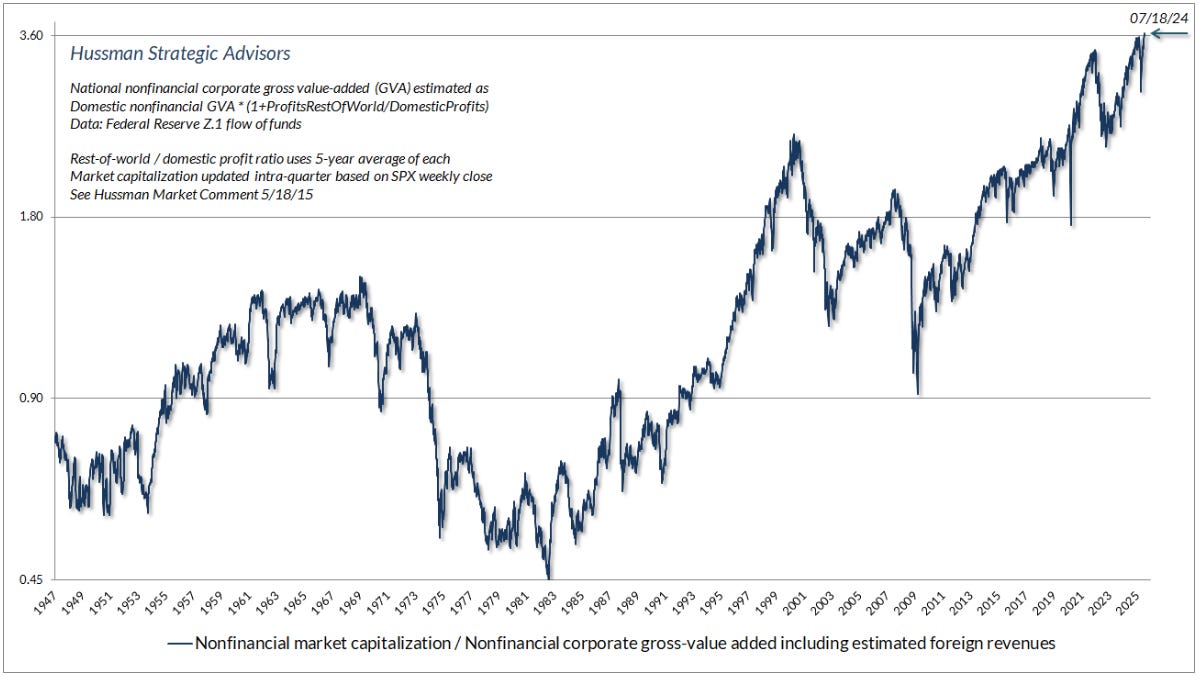
John Hussman believes, and I agree, this is one of the cleanest measures of valuing the overall market because it filters out earnings cyclicality. (Sales are much less volatile than earnings.) Thus, times when profit margins are way above normal, like now, or way below, can create a misleading picture of a cheap or, conversely, pricey market. For example, the P/E ratio was extremely elevated during the Great Recession due to the related earnings collapse. Yet, it was a great time to be a stock buyer. Conversely, today’s aggregate U.S. corporate profit margins are about 37% north of normal.
However, one criticism of using price-to-sales as your key valuation benchmark has been that because American companies do far more business overseas than they did in bygone days, this ratio isn’t as accurate as it once was. John’s adjustments largely eliminate that objection.
As a result, what we can see is that for the last six years, on this basis, the stock market has been more expensive than it was even at the end of the late 1990s spectacular tech bubble. Of course, that makes it the priciest market ever on this measure. My old stand-by, the price-to-sales chart (not shown) is telling a similar tale.
Back in the Bush 43 era, his VP, Dick Cheney, remarked that Ronald Reagan proved deficits don’t matter. Today, one could reasonably observe that the combined Trump/Biden/Trump (again) administrations have demonstrated that valuations don’t matter. Essentially, there is no question whatsoever that U.S. stocks are phenomenally pricey. But the relevant question, per the title of this piece, is: “Who cares?”
One notable person who does care is Warren Buffett. He has long advocated for comparing the S&P’s market value to the size of the economy. He has cited this so often that it has become known as the “Buffett Indicator”. As you can see, it’s flashing a strident warning totally in-sync with the Hussman approach.
The Buffett Indicator since 2007
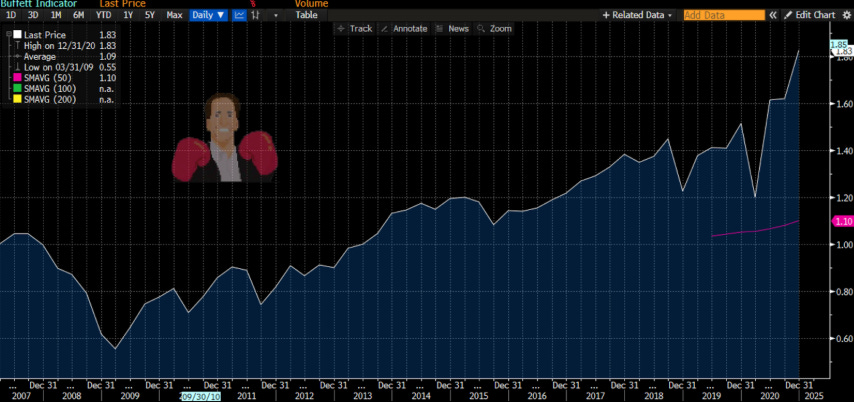
Actually, valuations are even more excessive – and dangerous – than they appear. The above is based on just the S&P 500. If you include the $4 trillion in crypto, much of it in value-free “securities”, the adjusted Buffett Indicator is around 200% of GDP.
It wasn’t that many years ago crypto was merely a rounding error but this is clearly no longer the case. Investors are increasingly choosing between stocks and cryptos as destinations for their risk capital. The fact of the matter is that a rapidly swelling number of investors, particularly the younger generations, view crypto as a stock substitute. For them, it is their “risk asset” of choice.
It is amazing to reflect back to the spring of 2009 when the entire S&P had a value of $6.6 trillion. As you can discern above, that was equal to about 60% of GDP. Of course, it was a screaming buy at that point. Clearly, the Buffett Indicator was also a much better gauge of how underpriced stocks were in early 2009… when most investors wouldn’t touch them with a barge pole. (Thank you to the ever-vigilant Mike O’Rourke for these fascinating factoids.)
Again, referring to the Buffett Indicator visual, the last decade has been a challenging one for value-oriented, reversion-to-the-mean investors like the aged Haymaker. The past five years have been particularly vexing, even though Covid, the 2022 bear market and this year’s “Tariff Tantrum” created some decent opportunities to buy into what were effectively global liquidity seizures.
Said a bit differently, they were worldwide margin calls. Even in the midst of radical overvaluation episodes, such as have mostly characterized this decade, these forced liquidation events can create outstanding buying opportunities. With the benefit of hindsight, they did and this newsletter advocated accumulation when it seemed like the whole world was dis-accumulating.
As many of you are aware, I recently did a podcast with my great friend and ally, Adam Taggart. In it, I opined that the U.S. stock market would eventually enter a “long, grinding bear market”, but that I didn’t believe this would occur in the near future.
What I should have made clearer is that I believe current conditions are consistent with the flash crashes we’ve experienced at various times this decade. These include the above-referenced radical overvaluation but also intense insider selling, rampant greed among retail investors, dramatic out-performance by the stocks of money-losing companies, a pronounced crowding into the most volatile shares, to name a few (with more to come).
Regarding that last point, please check out the following image, also from Jesse Felder (quoting a recent JPMorgan chartbook; we’ll get to JPM’s own stock price shortly):
High concentration in high beta – aka, highly volatile and risky – stocks

Here's the JPM text that went with this chart: “The latest bout of extreme crowding—currently in the 100th percentile—is in high-beta stocks. And this spans both riskier low value alongside speculative growth plays.”
Further, and with apologies to those of you who have already seen the following chart (it was part of the Adam Taggart podcast), the S&P 500 has a serious case of halitosis, otherwise known as bad breadth.

(Thanks to PauloMacro and Louis-Vincent Gave for the above.)
There is also the issue that S&P earnings estimates have been declining even as stocks rise. Should there be an economic slowdown, much less a recession, that situation will almost certainly become more pronounced.
Recession fears were intense back in 2022 and, admittedly, I shared them. As events unfolded, it was a close call as two straight contraction quarters were registered in the first half of that year. (Eventually, one was revised away.) Recession anxiety flared “bigly” again earlier this spring during the Tariff Tantrum but, now, those have almost totally evaporated. That’s why Friday’s shocking jobs report might loom very large.
The Pandemic Notwithstanding, the Largest Net Negative Payroll Revision in U.S. History (credit to Danielle DiMartino Booth for this graphic)

The massive downward revisions to the May and June initial numbers were particularly disturbing. Moreover, these are in line with the highly cautionary views the keeper of the closely followed University of Michigan’s Consumer Sentiment Survey, Joanne Hsu, shared with another of my podcast pals, David Lin, last week. (A link to that is attached at the end of this MHM; please take my word for it that she is extremely credible.)
Recessions always take the consensus by surprise. That’s likely a key reason stocks react as negatively as they do when one erupts. There hasn’t been a true recession in almost seventeen years. Unquestionably, we are way overdue for the next downturn. Of course, that doesn’t mean a downturn is imminent, but with such widespread optimism and no sign of economic contraction anywhere, the setup becomes dangerously lopsided.
For sure, when it comes to the economy, the general attitude is “Who cares?” Or at least that was the prevailing zeitgeist until Friday’s jobs related mic drop. Well, let me tell you that you should care… a lot.
Per JPMorgan, again, recessions lead to average stock market declines of 37%. The mildest recession reaction saw the market bottom at 14 times earnings. Coincidentally, or not, that would be almost precisely a 37% “adjustment” from the S&P’s current 22 times earnings level.
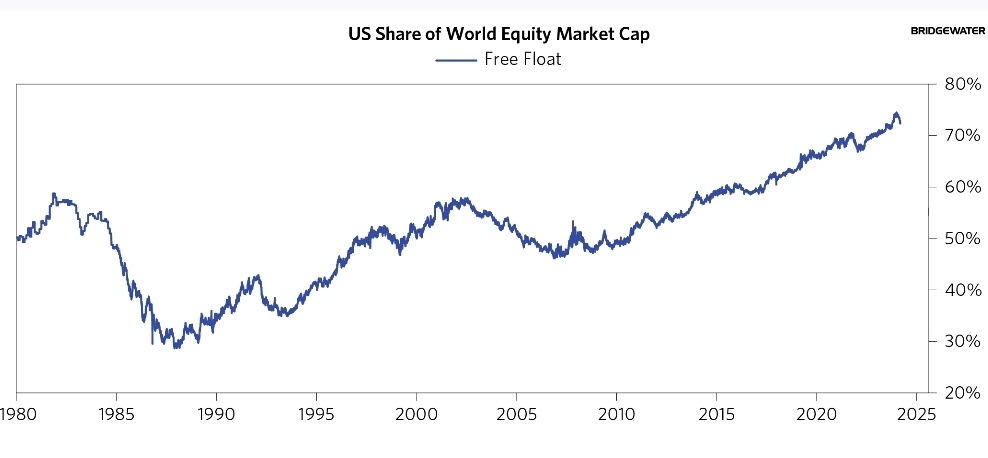
In addition to the worrisome data above, let’s not forget the speculative bacchanal in crypto that has reached Roman orgy intensity; or the reality that credit spreads are extremely tight (the corporate bond market equivalent of super-elevated P/Es); or that international investors are massively overweight the U.S. stock market (but are now increasingly edgy); or, finally, that American investors are essentially all-in with domestic equities despite that the investor class is the oldest it’s ever been.

Using freely traded shares, U.S. stocks are over 70% of global market value
The geriatric Haymaker will be the first to concede that there is almost as long a list of economic indicators that have been flashing red as there are on stock market overvaluation. In both cases, most of these have been in the danger zone for years. The fact that the stock market has continued rising and the economy has avoided an official recession only fed the “Who cares?” mindset.
In the spirit of this MHM, another “take profits” missive, I’m going to list a number of stocks that have run over the last year or two. In many cases, these were upside range expansions, or breakouts, above multi-year resistance. Usually, that ceiling has been in place for three years or more. In the brief text section following each name, I’ll indicate if a breakout did occur and, if so, at what price.
Because this MHM is focused on trimming winners that have run a lot, I’m not including those that have either gone up modestly, fallen somewhat, or, occasionally, been clobbered. As I’ve previously written, most of the big losers are oil-related, particularly Helmerich & Payne (HP) and Atlas Energy Solutions (AESI). Fortunately, with both of those we suggested a position reduction when they had surged, particularly with AESI.
Whenever I bring up those triggering words of “take profits” I’ve learned I need to clarify that this is meant to be a trim not a sell suggestion. In fact, I’m not recommending a full sale of any of the following stocks or commodities. Actually, in some cases, I’m merely pointing out that despite nice gains I’m not recommending any paring back, except for the most short-term oriented traders and/or those who feel the market is on the edge of a serious correction. Ergo, please, don’t blow this “take profits” MHM out of proportion.