Making Hay Monday - August 12th, 2024
High-level macro-market insights, actionable economic forecasts, and plenty of friendly candor to give you a fighting chance in the day's financial fray.
Charts of the Week
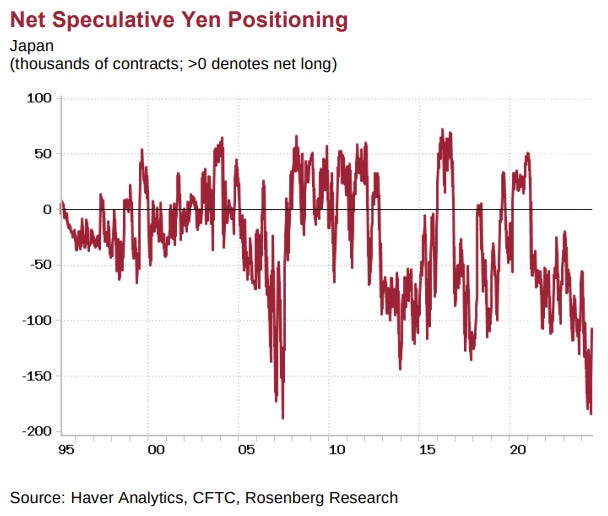
If you are curious why the yen experienced such an explosive rally recently, roiling financial markets around the world, please check out the above chart from the prolific team at Rosenberg Research. While we had previously run similar visuals on the yen’s detested status, it became even more so at the end of July, right before it was lifted by an epic short squeeze. The Haymaker team suspects this tells only part of the story about how off-sides the world was with regard to the yen. Speculative positioning essentially only picks up a small slice of those that have bet against Japan’s currency. An immensely larger de facto short position was the trillions borrowed in yen to invest in higher-returning non-Japanese securities.
The destination for those borrowings included U.S. mega-cap tech stocks like Microsoft, Apple, and, of course, Nvidia. This process involved Japanese households, corporations and financial institutions. Myriad foreign entities were also effectively short the yen, apparently including Berkshire Hathaway. It is impossible to know how much of this has been unwound, but our belief is that there is more to go. However, we do believe the weakest players have been flushed out of their shorts (after taking it in the shorts). If we’re right, the tremendous volatility in the yen and Japanese stocks should subside. This should also dial back some of the pressure on global financial markets.
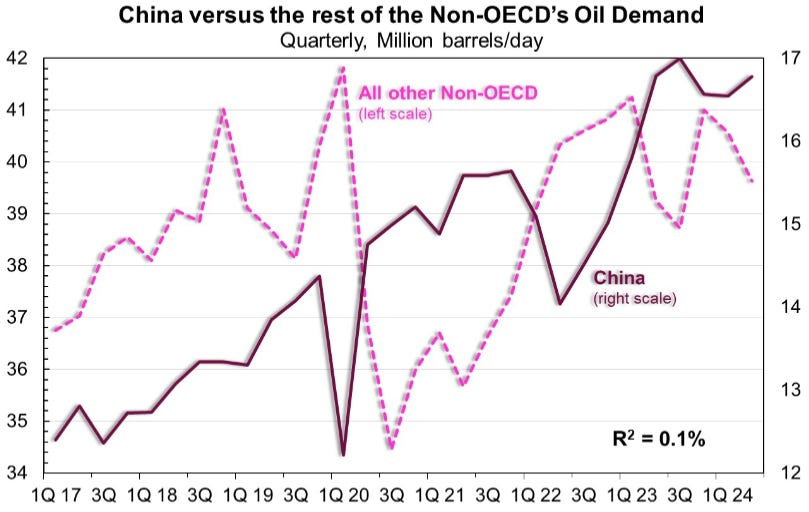
There is a pervasive belief that as goes China’s demand for oil, so goes the world. Yet, per the energy experts at Cornerstone Macro, the correlation (known in geek-speak as the R²) between Chinese and global oil demand is a microscopic 2.9%. Basically, statistically speaking, there is almost no linkage. July looks to be another example of that with global oil demand surging by around 2.5 million barrels/day versus July 2023, despite China’s on-going economic troubles.
“One of the things about a classic bubble is you do see smaller players fade before big ones start to suffer.” -Rob Arnott, founder and chairman of the board of Research Affiliates which has over $28 billion in client assets under management
A Good Recession For Financial Stocks?
Champions
There’s something weird going on in the financial markets these days. Appropriately, that pertains to the financial stocks themselves. Even as investors worldwide have gone into risk-off mode, the long-neglected financial sector has broken out to a new multi-year high, as you can see in the first chart below. This displays the five-year price history for the XLF, the leading financial sector ETF.
More impressively, it has achieved an all-time high (ATH), per the following image. Closely study that visual and you will notice a strong buy signal was produced in early 2021 when it broke above the pre-Global Financial Crisis peak, making a new ATH in the process. As you can further see, that was a profitable buy point. From there, it ran up about 30% in short order. Then in early 2022, however, it hit a wall… or, more accurately, a ceiling — one that it would trade below for the next two years.
It's not hard to come up with reasons why financial stocks — like banks, insurance companies, brokers, and exchanges — have been out of favor. For one thing, tech shares have stolen the show during that time frame and, in reality, for the past decade.


