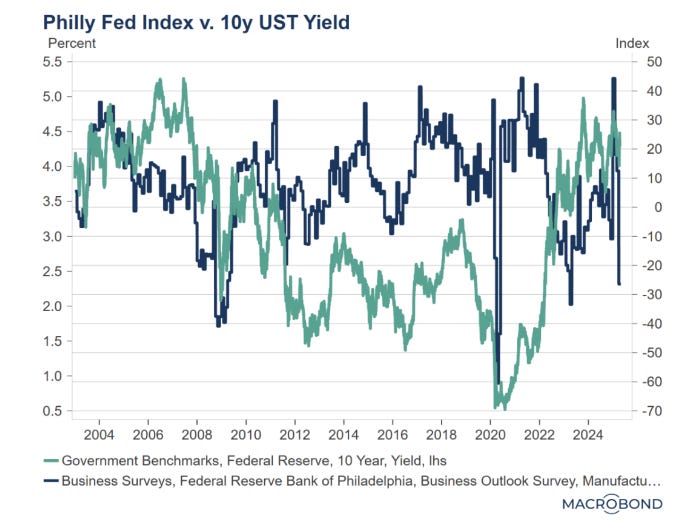
Similar to a wide array of economic releases, the Philly Fed Index is rapidly deteriorating. Per the always-vigilant Luke Gromen, it is swooning at a rate as precipitous as it was in 2008, the Global Financial Crisis, and 2020, Covid. However, a glaring difference is the behavior of the 10-year U.S. T-note. Typically, the primary federal government bond debt instrument rallies in price as the economic skies darken. Yet, as you can see from Luke’s chart, that is clearly not happening during this crisis. There are likely multiple factors at work, including the risk of foreign central bank disgorgement of their U.S. Treasury (UST) holdings. Another, however, might be the prospects of an explosion of UST issuance to fund the vaulting deficits that always occur during recession. Unfortunately, the federal red ink is going into this downturn at the inexcusable level of 7% of GDP, which is typically associated with wars and severe recession.
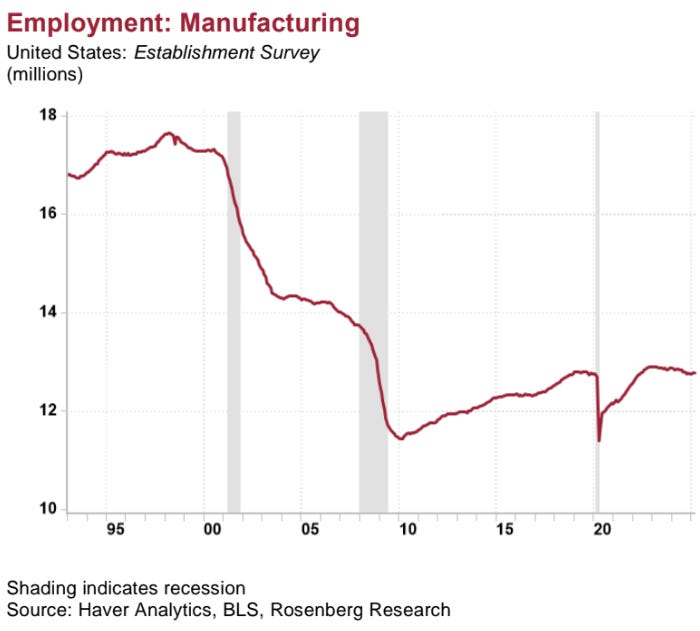
On the good news front, there is tremendous angst that the U.S. manufacturing base has been badly eroded. Undoubtedly, there are industries that have been seriously impaired by vicious overseas competition, particularly from China. Yet, for the last 15 years, American manufacturing employment has not declined. Further, over the last 40 years productivity has soared by 135% as the U.S. industrial complex dramatically increased its output, despite shedding in the vicinity of 5.7 million workers from 1985 to 2010. Essentially, America’s industrial output has doubled in real terms over the last forty years despite one-third fewer workers.
“Instead of rushing to buy overvalued assets in an overvalued currency, foreign investors are busy heading for the exit. Now that this trend has started, it is not obvious what will reverse it (except perhaps a massive crisis outside of the US” -Gavekal Research’s Charles Gave
“2020s: an era of higher inflation and rates (periodically interrupted by recession/credit events), US debt and dollar debasement, booms and busts in wide equity trading range, driven by new trends in society (inequality to inclusion), policy (monetary to fiscal), trade (globalization to isolationism), capital (repudiation of US assets), geopolitics (peace to war), tech (AI), environment (energy/food security), demographics (aging).” -BofA’s Chief Investment Strategist, Michael Hartnett
This is our final issue in our kick-off series in which we will roll out the last portfolio template or tracker. In this case, it is our ETF-based income version. One appealing aspect about this approach is that all the securities listed below are easily tradeable for retail investors, even in modest quantities. This is in contrast to specific issue bonds and other credit instruments which can be difficult, if not impossible, to trade in smaller denominations. Transaction costs can also be steep, even prohibitive. ETFs mitigate those, as well.
As you will see, there are some non-income-bearing natural resource-based ETFs included which might seem odd. The logic is that, while they don’t generate cash flow, they should be effective hedges from another inflation surge and/or further U.S. dollar debasement.
Per our last Making Hay Monday edition on the Individual Income Securities Portfolio, the appropriate weighing, or allocation, to a given ETF is a highly personalized decision. It’s best to involve a financial expert in whom you have a high degree of confidence in this process.


