Haymaker Chart Book - December 18th, 2023
A broad, insight-packed presentation of high-finance, economic, and industry/stock charts from the Haymaker and his top-notch external resources.
Final Monday Post of 2023 (one more Friday Haymaker ahead!)
Hello, Readers and Subscribers:
Today’s Monday edition is the last we’ll be running this year. After all, next Monday is Christmas, the following is New Year’s Day, and we suspect most of you will be a bit too busy for newsletter reading in both cases.
As indicated above, we will be publishing our final piece of the year this Friday (aside from any content we might send to Founding Members), so be sure to check your inbox before signing out until 2024. For our paying subscribers, we will be providing at least one Trading Alert to hopefully help you end this year with some actionable Haymaker-endorsed data for next year.
For today, we are running our first official chart book entry (last week’s was the “soft open” to borrow brick-and-mortar business terminology). Let us know in the comments section which of these charts/sections you really like and what industries/sectors you’d like us to zero-in on with our first chart book of 2024.
-The Haymaker Team
“…I must say that I struggle to understand (the) bond market's immediate reaction? The Fed's pivot strikes me as being terrible news for the (U.S. dollar), and by extension, for the long term returns of (U.S. Treasuries).” - Louis-Vincent Gave on December 14th in the wake of the latest Powell Pivot
The Bond Market & Federal Deficits
Chart Number One
The bond market has been celebrating the Fed’s vectoring to begin cutting rates sometime in 2024. Long-term interest rates have plunged along with short-term rates. The market is now pricing in six rate cuts or 1½% (150 basis points) next year. If that is correct, holders of extended maturity U.S. Treasurys (USTs) might soon begin to have some misgivings. Such aggressive easing, should it occur, is arguably unfriendly to long-term bonds, especially when the Supercore Services CPI is running at 6%. Additionally, the federal deficit in the first two months of this fiscal year, which started on October 1st, was hemorrhaging even more red ink than a year ago, as hard as that is to believe.
October and November saw the deficit rise by $47 billion over last year’s budget-busting first two months to $383 billion. In other words, that’s a $190 billion per month deficit rate. (If not for a timing shift of some government outlays, the deficit increase would have amounted to $56 billion.) The culprit wasn’t a revenue deficiency this time; tax receipts rose by $108 billion, but spending vaulted by $156 billion. This onslaught of bond supply to fund this budget shortfall threatens to overwhelm buyers, despite the current enthusiasm for bonds of all maturities, particularly on the already-fragile long end. Unfortunately, the below chart illustrates the negative fiscal multiplier, as frequently described by the illustrious Lacy Hunt. In other words, total economic activity (nominal GDP) is now increasing by less than the growth in federal debt.
Chart Number Two
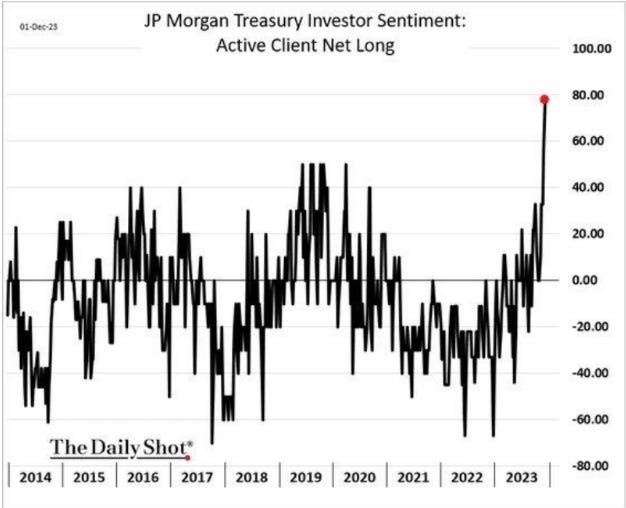
Even before last week’s explosive rally in long-term USTs, investors were all-in on the bull case for bonds. The vertical move in JP Morgan’s Investor Sentiment is truly breathtaking and is likely to become more so once the ebullience from last week’s “Fed Pivot Party” filters through sentiment surveys. In my view, this raises the odds of a sharp correction by long-term bonds in the near future.
Energy
Chart Number Three
Oil continues to trade defensively despite the Fed’s hints of relaxed monetary conditions and rising hopes for a soft-landing. A steady-stream of negative news, some of questionable validity, including from the consistently off-the-mark International Energy Agency (IEA), has led to a 26% faceplant by oil prices since late the September peak. This is despite inventories that remain frighteningly low when adjusting for the massive Strategic Petroleum Reserve (SPR) releases. Surprisingly, though, past instances of similar crude price swoons from 52-week highs (such as was hit in September) have generally been followed by strong returns from energy stocks.
(Click chart to expand)
Chart Number Four
Oil’s recent acute price weakness — as opposed to demand, which remains healthy — is even more perplexing due to the increasingly obvious challenges facing widespread electric vehicle (EV) adoption. Saturday’s Wall Street Journal ran a feature story on GM’s difficulties in this regard, despite its CEO’s (Mary Barra) aggressive push into EVs. Per the below chart from the oil market pros at Cornerstone Analytics, even if the number of EVs in the global auto fleet were to increase seven-fold by 2035, to 150 million units, there would still be almost an additional 800 million internal combustion engines on the roads at that point. Thus, the IEA’s record of underestimating global oil demand for decades, including by roughly 1 million barrels per day* in recent years, looks like it is set to continue. Despite repeated evidence to the contrary, the IEA is sticking with its forecasts of peak oil demand in the near future; as Jonathan Swift put it, “Reasoning will never make a man correct an ill opinion, which by reasoning he never acquired.” (Cornerstone Analytics’ Mike Rothman, on the other hand, has been as right over time as the IEA has been wrong.)
*Figure corrected since original posting.
The Fed & Other Central Banks
Chart Number Five
The linkage between global central banks’ balance sheets and the S&P 500 has been striking since the Global Financial Crisis that began in 2007. Yet, markets remain unperturbed by the ongoing selling of government bonds to effectuate this contraction of their assets. What they are doing now is known as Quantitative Tightening (QT), the opposite of the more famous, or infamous, Quantitative Easing (QE). Perhaps the correlation between de facto money printing (QE) by central banks or, alternatively, reversing this process (QT) and stock prices has been broken. However, it may be just a delayed reaction, as could also be the case with one of the most aggressive rate-hiking episodes in the modern history of central banks.
The Economy and U.S. Consumers
Chart Number Six
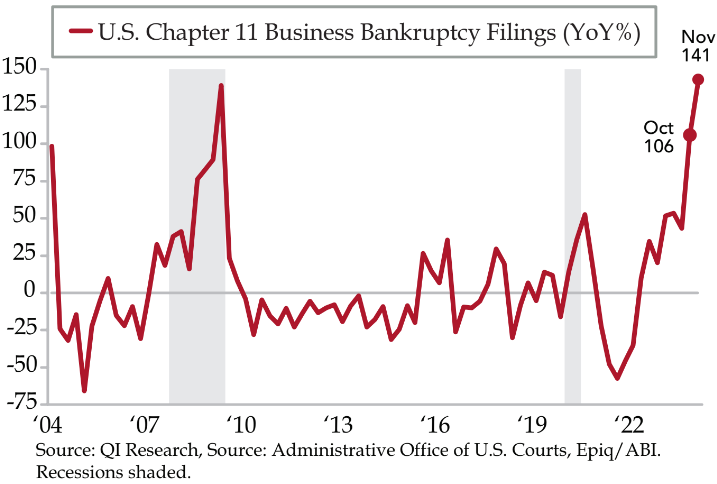
One of the more disturbing trends right now is the hockey stick-like rise in bankruptcy filings by U.S. businesses. These are now up 141% year-over-year, per my great friend and mentor, Danielle DiMartino Booth. As she notes, this breaks the prior record set during the Great Recession of a 139% spike. This obviously has negative implications for the jobs market where myriad leading indicators — such as the number of job quitters and temporary worker terminations — are also flashing bright warning lights.
Chart Number Seven
If you’d like to get a rosy take on the American economy, you might visit my good friend Adam Taggart’s website at Thoughtful Money. On December 5th, he posted a podcast with Wolf Richter who firmly believes in either a soft-landing or, possibly, no landing. This is despite the fact that he believes a recession is needed to cleanse the many excesses that have built up over the past 15 years of super-easy money polices by the leading central banks (until their recent tightening campaign that looks to be ending). One of Wolf’s bullish contentions was that consumers typically pay off their credit card balances in full each month. However, upon checking into this more closely, it appears that only about 44% of credit card balances are paid off each month. To be fair to him, though, the increase in the Average Total Bankcard Balance Per Consumer hasn’t risen much at all in recent years. On the other hand, with thanks once again to Danielle, the Average Total Unsecured Personal Loan Balance Per Consumer is telling a much more disturbing story.
Chart Number Eight
There is no doubt that the recent roaring bond market rally has improved the unrealized loss position by U.S. banks on their vast holdings of USTs. But it may be premature to declare crisis averted. First of all, as noted above, bonds look vulnerable to another sell-off. Secondly, the sheer magnitude of the losses was so severe — as you can see, dwarfing what happened during the Global Financial Crisis — that the hits to bank balance sheets remain staggering. Bank maven extraordinaire Chris Whalen, one of the few to anticipate this past spring’s banking convulsions, recently quoted the CEO of the conservatively run and well-capitalized Heritage Bank of Wood River, Nebraska:
The unrealized loss problems, whether bonds or loans, (are) so large and widespread that the FDIC does not have the funds (nor) the human resources to handle properly…many banks have zero or negative GAAP* capital.
*Generally Accepted Accounting Principle


