Friday Haymaker
Returning Guest, Jim Colquitt
“At the root of all financial bubbles is a good idea carried to excess.” -Seth Klarman
“Bull markets are more fun than bear markets.” -Bob Farrell, former chief technical analyst at Merrill Lynch.
Hello, Readers and Subscribers:
Our longtime followers know that we run quite a few charts, including plenty of our own from the talented Evergreen and Gavekal teams, and are always happy to share others on loan from peers and friends of the Haymaker. Today, we’re happy to once again highlight some superlative work from Jim Colquitt, who uses charts to great effect in vividly illustrating market activity. It’s been about a year since we first guest-posted Jim’s material, and with his blessing, we’ll probably do so a bit more frequently in coming months.
Jim’s Chart Book (which we have abridged for today’s Haymaker) covers a lot of ground, but the main theme pertains to an old standby that I originally came across from the legendary Ned Davis. Frankly, this is a historical reality that Wall Street conveniently overlooks, especially during raging bull markets. The essence of it is totally logical: when investors are heavily exposed to stocks, future returns — to use a highly technical term — suck. Conversely, when they are light on equities, long-term returns, like over 10 years, are stellar. You can probably guess what current conditions imply!
The good news for market bulls, however, is that Jim’s work indicates the near-term trend continues to be higher. Naturally, this doesn’t preclude a correction, but in his view that’s not likely to be the start of the next bear market… yet. Further illustrating our willingness to examine the bullish case, here’s a visual from another source we track, Wellington Shields, that validates the upside pressures based on their money flow analysis:
Despite Jim’s near-term constructive outlook, he is convinced bear markets haven’t become extinct. Thus, he feels it’s time to batten down the hatches a bit.
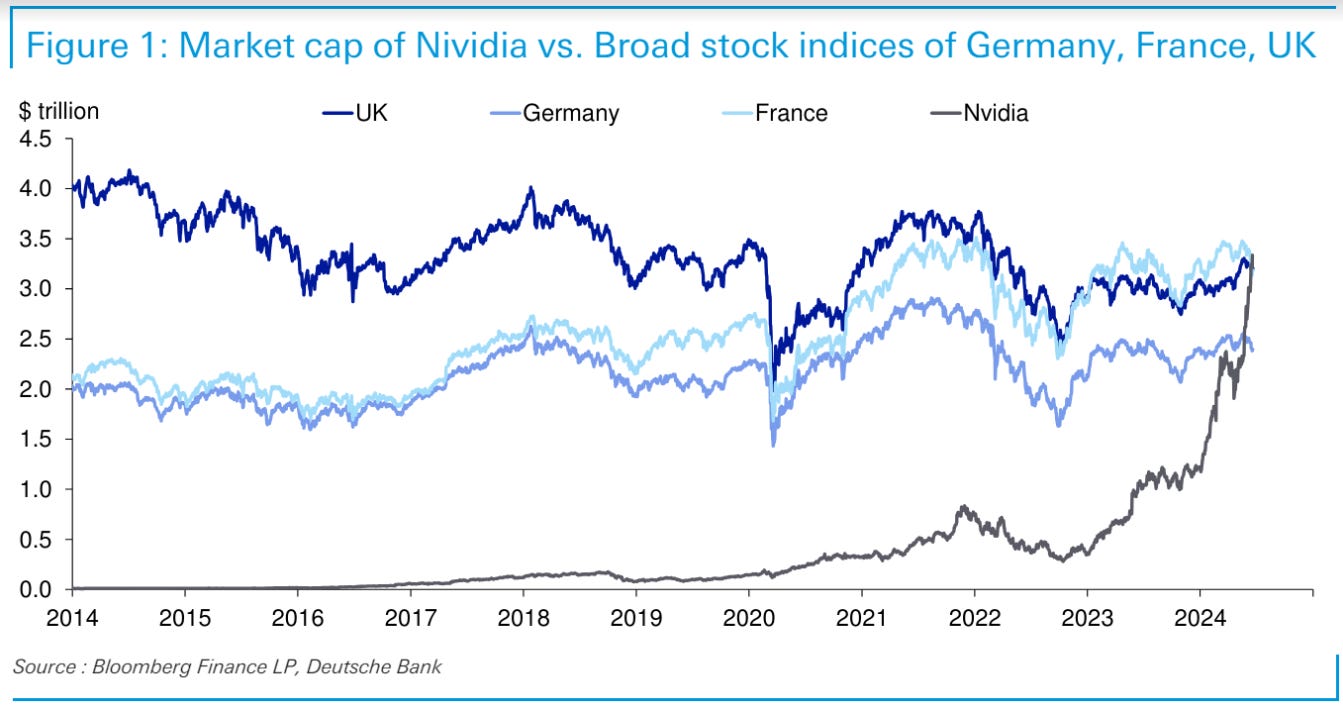
Personally, I believe the present extraordinarily narrow market, which has become heavily reliant on one stock — that would be Nvidia, of course — needs to either broaden out soon or a serious sell-off is highly probable. Here’s one more visual, in this case from Deutsche Bank’s Jim Reid, along with a series of factoids courtesy of that Jim, underscoring the incredible nature of Nvidia’s ascent.
Nvidia went from $2tn market cap to $3tn in 30 trading days from April 24th.
Nvidia has added a trillion dollars of market cap since May 20th. At 23 trading days this is the quickest a company has ever added a trillion dollars.
For context, Berkshire Hathaway, one of the most respected companies in the world, has taken around 135 years since its origins in the 1880 to get from zero to around $900bn today.
Nvidia, Apple and Microsoft are now worth a combined $9.95tn and look set to cross $10tn for the first time any day.
The last time the entire S&P 500 had a market cap of $10tn was in September 2010.
At the lows in 2009, the entire market cap of the S&P 500 was $6.11tn, less than double Nvidia today.
As it stands, Nvidia is on track to be the top-performing member of the S&P 500 for a second year running. In 2023, it was up +239%, ahead of Meta which had a +194% gain. In 2024 so far, Nvidia is up another +174%, far outpacing Constellation Energy in second place, which is "only" up 89%.
Exactly a decade ago the entire listed UK stock market was 400 times larger than Nvidia. In the last week Nvidia overtook it.
On Monday, we’ll be summarizing a podcast one of my other highly respected sources, Fred Hickey, recently recorded with my good friend Adam Taggart. Befitting the Making Hay Monday format, we’ll be homing in on some of Fred’s money-making — and loss-avoiding — ideas. (As a sneak preview, Nvidia figures prominently in his discussions with Adam. How could the stock that is suddenly valued like a large country not be?)
-The Haymaker Team
Weekly Chart Review
Quarterly Update: Average Investor Allocation to Equities
Jim Colquitt (Complete version published June 10th, 2024)


